Create PDF Documents in Python With ReportLab
ReportLab is an open source toolkit for creating PDF documents from Python. It is a very extensive library with many features, from small texts and geometric figures to large graphics and illustrations, all of which can be included in a PDF. In this post we will be approaching to its general features and main functions to create this type of documents.
The library is simply installed via pip:
pip install reportlab
The source code is hosted on this Mercurial repository.
First Steps
ReportLab includes a low-level API for generating PDF documents directly from Python, and a higher-level template language—similar to HTML and the template systems used in web development—called RML. Generally, the second option is usually more convenient for those who must make exhaustive use of the capabilities of the library when generating documents. For the rest of the cases, the low-level API that we will describe in this article will suffice. However, you can find the official documentation for the package in its entirety at this link.
The most basic code that we can find using ReportLab is the one that generates an empty PDF document, which is the following.
The first thing we do is import the reportlab.pdfgen.canvas module, then we create an instance of the canvas.Canvas class passing it the name or path of the file we want to generate as an argument, and finally we call the Canvas.save() method that effectively saves the changes to the document.
While our c object represents the entire file we're working on, a canvas should be thought of simply as a blank sheet of paper on which to write, draw, or whatever. These writing or drawing operations will always occur between the creation of the document (line 3) and the method that saves the changes (line 4).
Let's start, then, by writing our first text in the document (remember that this line is located between the previous two).
Now when you open the hello-world.pdf file you will find our little message in the bottom left corner of the page.
As you may have guessed, the first two arguments passed to drawString() indicate the (x, y) position at which the text will appear. Unlike most popular desktop application development libraries, in ReportLab the origin of the coordinates (that is, the (0, 0) position) is at the bottom left. That means the Y-position increases as you go up the screen, and the X-position increases as you scroll to the right. This inversion of the Y axis can be a bit confusing at first, but it does not present any additional difficulty, just remember these issues when positioning the objects.
That said, it is essential to know what the measurements of each sheet are when generating the document. Height and width correspond to standard A4 measurements, which is used by default when creating a canvas. Sheet dimensions are expressed in points, not pixels, with one point equaling 1/72 inch. An A4 sheet is made up of 595.2 points wide (width) and 841.8 points high (height).
By creating an instance of canvas.Canvas we can specify an alternate dimension for each of the sheets via the pagesize parameter, passing a tuple whose first element represents the width in points and the second, the height. We said that the default dimensions are those of to the A4 standard; the reportlab.lib.pagesizes module provides the dimensions of other standards, such as letter, which is the most widely used in the United States.
|
>>> from reportlab.lib.pagesizes import A4, letter
|
|
>>> letter
|
|
(612.0, 792.0)
|
|
>>> A4
|
|
(595.275590551181, 841.8897637795275)
|
Thus, to create a document with the dimensions used in the United States, we would do the following.
And to use the dimensions of standard A4:
Which results in a document equal to the first one we created, because pagesize is A4 by default.
Now that we know the height and width of our sheet, we can use them to calculate different positions within it. For example, to write our message in the upper left corner with margins of (approximately) 50 points:
|
from reportlab.lib.pagesizes import A4
|
|
from reportlab.pdfgen import canvas
|
|
|
|
w, h = A4
|
|
c = canvas.Canvas("hello-world.pdf", pagesize=A4)
|
|
c.drawString(50, h - 50, "Hello, world!")
|
|
c.showPage()
|
|
c.save()
|
In this case we have added a call to c.showPage() before saving the document. This method tells ReportLab that we have finished working on the current sheet and want to move on to the next one. Although we haven't worked with a second sheet yet (and it won't appear in the document until anything has been drawn) it's good practice to remember to do so before calling c.save().
We'll come back to writing later, first let's look at how to draw some basic geometric shapes and lines.
Geometric Shapes and Lines
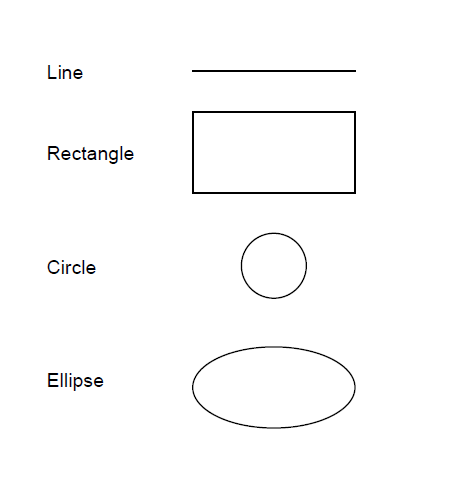
ReportLab allows you to draw lines, rectangles, circles and other figures in a simple way. For example, to draw a line we call the line() method indicating the position of the two points of the segment: x1, y1, x2, y2.
For a rectangle, rect(x, y, width, height).
roundRect() operates similarly, but a fifth argument indicates the radius by which the ends are curved.
In the case of circles, the position of the center is indicated followed by the radius.
Lastly, for ellipses the arguments are similar to those for lines.
Putting all this together we can generate a PDF document like the following.
Other methods for generating shapes include bezier(), arc(), wedge(), and grid(). We will talk about the latter at the end of the article.
Styles
So far, both the text and the figures that we have drawn have used the default styles (basically black and white colors). You may have noticed that the functions we have been using do not support arguments such as foreground or background to indicate the color of each drawing in particular. Instead, the styles are set directly on the canvas (the sheet), and all operations on the sheet that follow this setting will use the indicated styles. When we change the sheet (showPage()), the styles are lost and must be set again if necessary.
So, for example, the setFillColoRGB() method sets the fill color of any object drawn on the sheet, so the following code outputs the text "Hello world!" and a square both in red.
|
# RGB values between 0.0 and 1.0.
|
|
c.setFillColorRGB(1, 0, 0)
|
|
c.drawString(50, h - 50, "Hello world!")
|
|
c.rect(50, h - 150, 50, 50, fill=True)
|
Note that functions that draw shapes include the fill argument (False by default) to indicate whether they should be colored.
Also, the setStrokeColorRGB() method sets the border color of shapes.
And to alter the font and size of the text drawn via drawString(), we use setFont().
Texts
Although drawString() is sufficient for some words, it is somewhat inconvenient when drawing medium or large texts, since it is not capable of accepting line breaks. For tasks like this, ReportLab includes text objects, a more specialized way of drawing text.
At first we must create the proper object, indicating where we want to position the text.
Once this is done, we proceed to configure the different styles from the created object. For example, here we also have a setFont() method, but it acts on this particular object and not on the rest of the sheet.
Via the textLine() method we add lines of text to our object.
|
# The two sentences appear on two different lines.
|
|
text.textLine("Hello world!")
|
|
text.textLine("From ReportLab and Python!")
|
Or also:
|
# The textLines() method supports the line break character.
|
|
text.textLines("Hello world!\nFrom ReportLab and Python!")
|
Once the text is written, we draw it on the sheet.
Other methods for formatting text include setCharSpace(), setWordSpace(), and setLeading(), which take the size of the distance as an argument (in points) between respectively two characters, two words, and two lines.
Images
To insert images in a PDF document, ReportLab makes use of the Pillow library, which is simply installed via pip install Pillow.
The drawImage() method takes as arguments the path of an image (it supports multiple formats such as PNG, JPEG and GIF) and the (x, y) position at which you want to insert it.
We can shrink or enlarge the image by indicating its dimensions via the width and height arguments.
When we need to make calculations from the dimensions of an image, it is convenient to open it first via ImageReader(). For example, if we want to place an image in the upper left corner of the sheet, it will be necessary to know a priori the height of the image to calculate the position on the Y axis:
Grids
When generating grids, ReportLab makes our work easier by providing the grid() method, instead of having to do it manually via line() or lines() functions, which takes as its first argument a list of positions in X and as its second a list of positions in Y.
And here is the result:
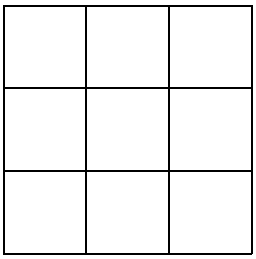
As you may have noticed, xlist indicates the positions on the X axis of the start of each of the vertical lines, while ylist indicates the start (on the Y axis) of the horizontal ones. Based on this information, the library is in charge of constituting the grid in its entirety.
As an illustration, consider the following code that generates, using this method, a grid of students with their respective grades.
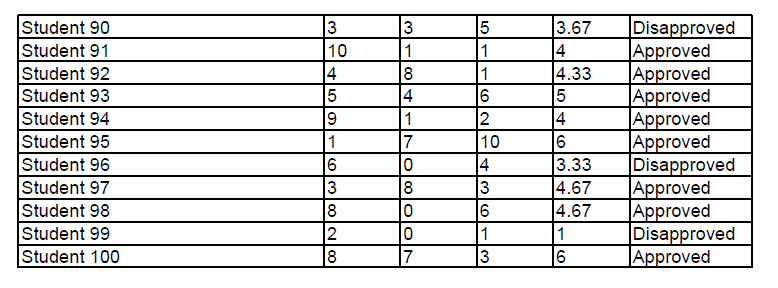
(If you are from the US, think of 10-1 grades as A-F grades, "Approved" as "Passing", and "Disapproved" as "Not passing".)
Conclusion
We have examined the main features of ReportLab, although it is only a small selection of its vast collection of functionalities as we have discussed at the beginning of the article. Those who require a more exhaustive use of the library will have already known the basics and I refer them once again to the official documentation to get involved in the most complex tools.