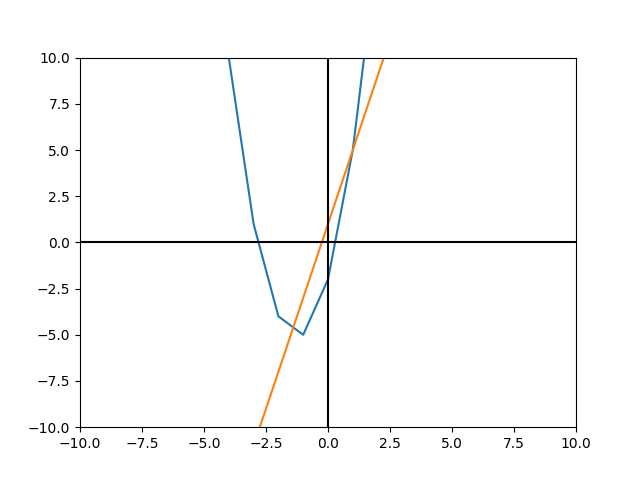
The following source code shows how to plot two mathematical functions (one linear and one quadratic) using the Matplotlib library, save the result to a PNG image, and display it on the screen. The functions are:
This is the resulting image:

And the code:
|
import matplotlib.pyplot as plt
|
|
|
|
# Quadratic function.
|
|
def f1(x):
|
|
return 2*(x**2) + 5*x - 2
|
|
|
|
# Linear function.
|
|
def f2(x):
|
|
return 4*x + 1
|
|
|
|
# The X values to be plotted.
|
|
x = range(-10, 15)
|
|
|
|
# Plot both functions.
|
|
# The second argument calculates the Y value for each of
|
|
# the X values defined above.
|
|
plt.plot(x, [f1(i) for i in x])
|
|
plt.plot(x, [f2(i) for i in x])
|
|
|
|
# Configure the color of the axes.
|
|
plt.axhline(0, color="black")
|
|
plt.axvline(0, color="black")
|
|
|
|
# The range of values shown by each axis.
|
|
plt.xlim(-10, 10)
|
|
plt.ylim(-10, 10)
|
|
|
|
# Save the plot as a PNG image.
|
|
plt.savefig("output.png")
|
|
|
|
# Show the result.
|
|
plt.show()
|
The Matplotlib library required by this code can be installed via python -m pip install matplotlib.
